Monday, April 29, 2019

Final Post: 4 Years in Review and the Last C-Astral Flight

As of writing thing, the senior capstone project is effectively complete. In the past week, we have presented three posters at the SATT poster symposium, finished a department display case, have started organization of an intended publication, and have processed several hundred gigabytes of data that will be useful to further classes and research endeavors. In many ways, there is much to be completed here at Purdue that unfortunately I will not be able to (directly) continue with, but I know the program is being left in good hands with capable faculty and students. Being part of the inaugural class, I was initially nervous that the program would not be ready and put me at a disadvantage in the early days of my career. Now, four academic years after my initial lecture in the program, I have realized that I had nothing to worry about.

Graduating next week, I want to use this final post as predominately a reflection on the program, the great successes of its structure, and how it has changed how I envision UAS as a whole. While I may have one final additional post in the future to link in a future blog or website for my work in following years, this is the final sustenance post for this capstone.

Years in the Program

The program, if intentional or not, is really structured around a few main conceptional pillars.

1) UAS regulation, industrial knowledge, and trends
2) UAS engineering, construction, and repair
3) UAS manual and autonomous flight operations
4) UAS data collection, processing, and analysis
5) UAS applications

During my time in the UAS major, each of these pillars were explored in a variety of capacities at different times and to different capacities. While some of these sections were certainly weaker at different points in time, they are all now fundamental in the curriculum, or at least strong enough to where every graduate can address each of them professionally. It is in these pillars that I think the program is exceptionally unique, and where its value versus other UAS programs is founded. Like many other collegiate UAS programs, we are nested in a larger organization, Purdue Polytechnic, and more specifically the School of Aviation and Transportation Technology (SATT). However, unlike other programs, we have gathered the identity of UAS as a field. In most other institutions, the UAS program adopts the identity of their parent organization. It would be easy for us to take on the perspective of our aviation host organization exclusively, just as it is easy for other UAS programs to focus on an engineering centered curriculum if they are part of an engineering college, or a large military UAS curriculum if that is the industry the parent institution works with most. However, this single topic centered design is harmful to UAS students. UAS is truly, at least in its current state, a field of disruption. Where drones are valuable is in the conversation of expensive and slow tasks into a quick and cheaper alternative. UAS is literally the democratization of aviation to the point where not only is aviation oriented careers possible by individuals of lower economic status, but entire industries that could benefit from UAS can have access to the field.The broad approach to drone technology by our department allowed me to think broadly about UAS, and connect any aspect of the field to any other aspect. I learned to think critically about drone technology to the point where I learned to adjust the parameters of what has been done to be useful where drone have not been used before. This has allowed me to start the foundations of a research career both at Purdue (Figures 1-4) and at different institutions (figures 5-6).

Figure 1: In the field with Todd Horn, preparing a phantom 3 ADV UAS for forestry research.

Figure 2: Launching an E-Bee UAV for agriculture research.

Figure 3: Presenting my research on UAS use as a forestry survey tool for small forest plots at the Purdue Undergraduate Research Conference.

Figure 4: An automatic motor testing stand designed and built by Ryan Ferguson and myself to identify efficiencies of sUAS motor/propeller combinations. 
Figure 5: Myself flying for a kelp forest research project with scientists at UCLA.

Figure 6: Multispectral kelp forest data from the flight in figure 5.
 While I am choosing a research career, many of my fellow students are not. The strength of the program's approach is that any student can reasonably build expertise in a number of different fields. We have graduates becoming managers, engineers, scientists, pilots, and technicians. All of which, have skills that would make them candidates in the others. Truthfully, this is how UAS has to be approached, because a drone engineer needs to understand the needs of the data scientist who will utilize his system, or the technician who will use it in the field. Likewise, field operators need to understanding the engineering of their platform to correct issues in the field. A multidisciplinary approach is the only way to teach UAS, and this is what I feel Purdue UAS has done well.

The structure of the program has also been very accommodating to new learners. With an early emphasis on understanding systems, drone construction (Figure 7), advanced manufacturing techniques (Figure 8), and experimentation (Figure 9), students can grasp the foundations of the technology quickly.

Figure 7: A quadcopter design I created for a class in the earlier years of the program.
Figure 8: A 3D printed phone case I made using techniques taught in early drone manufacturing and systems classes. 


Figure 9: Modified 3DR Solo UAS to act as an airborne radio repeater for search and rescue operations. Designed as a sophomore class. Contains 3D printed parts designed by myself and fellow students.

 After the courses structured towards designing and tinkering, we have courses meant to introduce us students to manual and autonomous drone operations. Sometimes with significant success (Figure 10) and sometimes with initial failures (figure 11). After the flight portions of the class, we had courses designed to introduce students to applications and UAS data, especially the course I now TA for, AT 319, which has had a significant redesign recently. Many of the data product skills learned in the class are present through the blogs of this page (Figure 12). Lastly, a series of capstones to combine all the individual skills we had learned. With this course structure, I feel I could perform successful at almost any career in the UAS industry.

Figure 11: Flight of a modified inspire 1 UAS. We added multispectral imaging capability to the aircraft in addition to its usual payload.

Figure 12: A midair collision during a mutli-platform flight exercise early in the curriculum. 


Figure 13: A 70 ha orthorectified mosaic data-set of Tippecanoe County Amphitheater park. 1.3 cm/pixel. To see this image as a map with scale, see previous blog post.
 The structure and methods of the program has equipped me with the capability to become a successful scientific researcher. I have no doubt that the entirety of my skill-set gained through this program will aid me in my future endeavors. While I do not plan to be an engineer, I am certain my fundamental understanding of aeronautical science and understanding will help me in some form of emergency or go-no-go decision in the future. I am confident that somewhere, somehow, even tangential skills such as 3D printing will be useful in integrating a sensor or prototyping a design. I know that skills such as (but not limited to) GIS, remote sensing, crew resource management, safety management systems, flight operations, flight planning, aeronautical decision making, and aerospace regulation will be as critical to my success as my future skill-set in ecological science methodologies. I hope to stay close with my fellow students, not just for memory sake, but because I am certain our contrasting specialties will be useful together.

Final Flight

Briefly, I want to introduce the final flight and dataset we collected as a class. We flew our longest mission with the C-astral platform yet, at 68 minutes, and captured data for a 100 hectare area that was almost a kilometer away from our launch site. The large size of the platform allowed the aircraft to remain in view the entirety of the time. Today, I had finished the processing on the collected dataset of over 1600 images. At about 1 cm/pixel the following images contain subset screenshots of the Purdue Wildlife Area operated by Purdue FNR as taken from our dataset. Please enjoy the following images at your leisure. Boiler Up, Purdue Class of 2019.

Figure 14: Purdue Class of 2019 (few members not present).


Figure 15: C-astral Bramor post landing.


Figure 16: Subset screenshot image of the PWA. Shows drastic heterogeneity of the landscape. 

Figure 17: Subset screenshot of PWA ponds. Clear measurable quantities of surface algae.

Thursday, April 25, 2019

First Weeks of April: Outreach and the State of the Technology

Closing in towards the end of the academic year, a serious of opportunities presented themselves during the first few weeks of April. These opportunities generally centered around UAS outreach, education, and development. While these sub-fields are generally tangential to the tasks of this capstone, as well as the quintessential UAS operator who is likely paid to accomplish a very specific task, they are as important as any other aspect of unmanned aviation. UAS is facing on ongoing identity crisis driven by misconceptions created out of privacy concerns of civilian UAS and the shadowy past of military unmanned aerial vehicles. People will naturally distrust unmanned aviation because they have been culturally predisposed to. Thus, UAS education and outreach is not only a means to enhance the common understanding of the advantages of drone technology, but imperative for the maintenance and perpetuity of the field's existence. For this reason, it should be the natural mission for every individual in the drone community to drive a healthy understanding of UAS in the populous, while also being receptive of any legitimate concerns for the technology.

Through my experiences, especially through April, the easiest way to grow trust with the general public is to make clear how UAS will impact their life for the better. In particular, driving exposure into the more obscure, more profound, and less direct (obvious) ways in which the technology will intercept their lives. The sheer volume and magnitude of ways UAS will benefit the average person during their life time justifies the technologies existence, but most people simply do not see past the obvious applications. Most people can relate to the concept of package delivery because the drone is front in center in that concept, directly visible in the interaction with the person. However, people generally do not make the connection with benefits in their life brought on by UAS that are more abstract. In fact, during Aviation Day (see further in blog post), I was often met with stunned expression when I explained that drones will lead to health benefits due to less pesticides used in crops, cleaner parks, better city planning, new ways to fuel a family car, provide new models of climate change, sustainably bring seafood to their plates, and lead to the generation of entire new forests.

In addition to outreach, it is imperative that the drone community continues development of UAS theory and academic understanding. This does not just mean scientific and academic publications, but that we, as a community, educate others on the state of our industry so that they can be more capable participators in the industry themselves. This can be simple things, such as teaching a class to would-be hobbyists on drone regulations. It is could also be more complex, such as leading a discussion with experienced commercial drone operators on the theoretical differences between small and large UAS operations. With how fast the UAS field grows, it is required that the theoretical aspects and understanding of UAV operations grows at a comparable rate. This is important not only for the assurance of safety and the inclusion of ethics of operations, but for the development of new effective means of operating UAVs. This month, I had come to realize that the Purdue University UAS major has enabled me to not only think critically regarding the current extent of drone technology and methods, but consider the theoretical building blocks of UAS abstractly, and fine tune my abilities as a good UAV pilot. This month was largely about sharing that information with others through outreach and education.

Purdue Aviation Day - 2019

Like the past few years, I planned and participated in Purdue Aviation Day, specifically the parts of the event centered around UAS. This year, we focused on a strong outreach goal in developing general understanding with the public in how drones will change their lives, versus just showing off our equipment and tools. Front and center was the opened UAS data lab, the classroom for AT419. At the front of the room, we displayed a large mural that myself and a few classmates made denoting various aspects of UAS and the fields that drones are currently helping with (Figure 1).

Figure 1: White Board Mural for Aviation Day
In addition to the mural, we had dozens of data products generated between AT409, AT419, and AT319 on all the computers as well as some research products. On the big screens, we had geospatial video project examples as well as manipulable 3D model and point cloud examples. Throughout the day, people would visit the room and we would share details about what the room was sued for, what the data on the screens was for, different ways drones are changing the world, and how drones may effect their lives personally. This prompted many very constructive conversations. Outside the room, we had posters on the wall showing how drone imagery is more detailed than Google Earth, and another with attached pens where guests could write how drones will change their lives. Out in the hallway, we had a display with some of our program's more prominent aircraft (figure 2).

Figure 2: The Aircraft Display for Aviation Day

Lectures and Presentations 

Around the time of aviation day I also had the opportunity to lecture for a few different classes. Below are the descriptions of each and a link to the associated presentation powerpoint.

AT319 Lecture on complex UAS - Being that AT319 students are the next cohort to be operating the complex aircraft of AT409 and AT419, I generated and presented a lecture on the intricacies of complex UAS operation. In particular, on how there is a categorical difference between how and when the workload of a flight crew is applied, and how there is a trade-off between survey capability and control over the operation. The lecture went very well and I think this is some of the first formal documentation of a UAS operational theory that I have generated. I will take this formal way of thinking about the issue into my future UAS operational endeavors and will perhaps do a more formal study of its potential. I plan to add to this presentation to create a complete lecture on complex UAS methods, as of now it is only a few slides and extremely discussion oriented. - Link Here

Lecture on UAS in Fisheries and Natural Resource Management- I was asked during aviation day to present a lecture of UAS applications in fisheries and natural resource management fields such as forestry. I created a presentation that mentions current and future uses, important considerations, sensor options, and unique aspects to aquatic remote sensing. This lecture was presented to a class of fishery students. - Link Here

Lecture on a Forestry Case Study  -Lecture was given to a group of remote sensing students on the specific UAS operational and processing considerations necessary in a complex woodlot near Purdue university, the McCormick Woodlot. - Link Here

In addition to these lectures, I will be presenting original research at the Polytechnic Research Conference on April 26 in the form of a poster.


Tuesday, April 9, 2019

Week of 4/1: Initial Data Products

This week was centered around the completion of a series of products. First, the initial processing of C-astral data was completed. Also, this week we completed additional M600 and C-astral data collection flights. Finally, the posters for the aforementioned poster symposium were completed. For the poster that will shared at the symposium, click here.

C-Astral Flight 1: Data Alignment Issues

The C-astral data collected during the flight in the previous week has been processed - but not without issues. The majority of the week was spent trying to understand the C-astral PPK correction system. PPK is a means of spatially aligning data to a geo-corrected standard. This method utilizes a ground station that has a precise GNSS fix as a known point. Each of the individual images captured during the flight have their position marked within an associated rover file saved within the aircraft files. The position of the marked images is then corrected based on the known point, providing a means of ensuring extremely accurate data post-process. The window for post-processing the UAS imagery is present in the C3P flight planning software (Figure 1).

Figure 1: C3P post-processing window


In order to post process the imagery, the rover log from the aircraft must be uploaded in addition to RINEX files from the known fixed point. We used the INWL based station in West Lafayette, IN which is part of the NOAA CORS network. After the rover log and base station data is inputted, images much be uploaded. From there, additional settings can be imputed. We used the Apply Geiod and write EXIF settings.

The primary issue we were having was related to the PPK correction. After corrected and processing, we noticed that the orthomosaic was not spatially matching with the basemap in only one axis. See figure 2 for an example. It took us a long time to discover what exactly was causing this mismatch. We assumed there may have been issues in data logging, converting geographic projections, or a geo-correction issue in Pix4D. However, after a few days of trial and error, we discovered that the issue was related to the image numbering system.

Figure 2: Spatial mismatch in initial orthomosaics
The first clue that the issue was image numbering was that the images were only mismatched in one direction. Looking back at figure 2, it is clear that if the image was shifted up, the roads would align with the basemap. This suggests that the entire image is shifted downward. Since the aircraft flew parallel to N.River Rd (in figure 2),  a potential cause of this mismatch is if the images had incorrect Lat and longitude associate with them. Only one dimension of alignment would be shifted due to this since the aircraft flew almost exactly a North-South series of transects. Longitude would be very different between images due to this transect direction, but latitude would be. Thus, if images were given coordinates belonging to a different image along the transect, the shift would be downward, just as it is in this case. During the attempt to discover if this was the issue, we discovered that the amount of images taken did not match the amount of images the aircraft recorded. Despite clearing the logs and reformatting the sensor data storage before flight, there was an issue matching sensor images to sensor triggers. This comes down to a design issue in the C-astral aircraft where it must be turned off after any practice captures, which is not listed in the checklist. To fix this mismatch, we copied the first image three times at the start of the image data set. This allowed for the creation of three throw away images that took up the three extra sensor clicks, and the sensor triggers should then on match the number of images. After using this method, the problem was solved (figure 3).

Figure 3: Aligned orthomosaic
From there, we were able to fully process the imagery. While some areas towards the edges or deep within the forested areas within the final mosaic did not align particularly well, the majority of the data aligned properly. The result is a 75 hectare map (Figure 4).

Figure 4: Simple map of flight area


Zooming in on this final orthomosaic, the true detail captured by the 42MP sensor from about 400ft above ground level is very clear. Individual pieced of trash, the internals of trash cans, individual parts of chairs, weeds in the ground surface, cracks in sidewalks, and even emblems on the crews' clothing are visible. The advantage of this level of detail in RGB from a remote sensing context would be the ability to classify nearly anything present within the 75 hectare area discretely. This data set would be particularly potent using a GOBIA classification workflow since texture and shape information is available at a very fine resolution. The following five figures show how detailed this orthomosaic is.

Figure 5: Zoomed-in on the amphitheater, visible on the Southern end of Figure 4  


Figure 6: Zoomed in on amphitheater further. Notice individual weeds and paths where water has previously flowed are present


Figure 7: The chair section of the amphitheater


Figure 8: Cracks in the pavement and view of partially empty trashcan


Figure 9: Rock piles in the imagery, weeds visible

M600 Data

 Some of our most preliminary m600 collected data has been processed this week. In particular, the initial steps of the amphitheater 3D modeling project. To model the amphitheater in 3D, two different flights were conducted. A grid pattern at 60 degrees and a grid pattern with the camera set to nadir. For some reason, the sensor did not change directional orientation during the flight leading to a quality bias towards the north (figure 10 shows the camera direction with a sparse point cloud). The nadir data set is yet to be processed. After each are processed separately, the data sets would be combined to produce a very high quality 3D textured model produced through structure from motion photogrammetry. While the project is not yet complete, the following images show the dense point cloud and textured mesh for the angled data product. 

Figure 10: Camera location and angle for amphitheater data set collected at 60 degrees camera


Figure 11: Amphitheater dense point cloud

Figure 12: Point cloud showing sloping ability within the model. Green and blue points are ground control markers


Figure 13: Textured mesh from the front of amphitheater
Figure 14: Textured mesh showing trees, pavement cracks, lampposts, and decorations within the model

Monday, April 1, 2019

Week of 3/25: First Field Week

 First Flight Attempt and Redemption

This week had many major developments for the semester project. Finally, the weather is good enough to actually begin field work. To begin the week, on Monday, we had the opportunity to get a small team together to fly the M600 UAS. Being that it would be it's maiden flight, a small area was chosen. The goal was to fly around the amphitheater in our target park to create a 3D model.We set out Aeropoint ground control markets around the amphitheater near permanent locations to assist in the orthorectification (Figure 1). Points were also placed along topographic gradients to help improve the precision of information in the Z-axis.

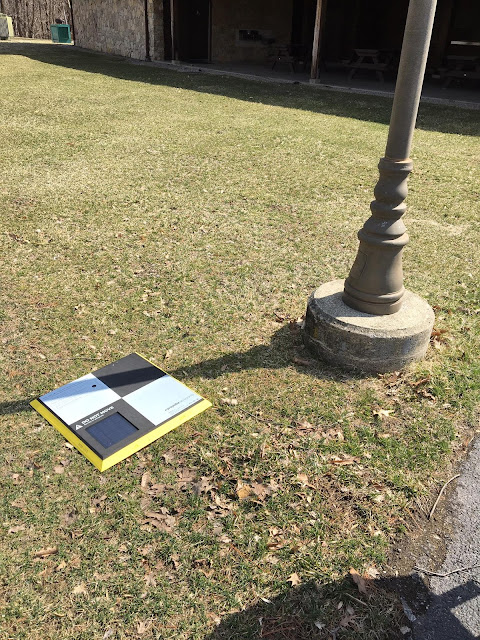
Figure 1: Ground control point placed near light post.
After setting out ground control points, we began setting up the aircraft (Figures 2 & 3).  After setting up the aircraft, we unfortunately ran into an issue with calibration of our compass. It was unresponsive to the calibration exercises. Compass health, as well as the prompts that were being displayed, were indicative of significant interference. In our opinion, the most likely culprit were underground power lines. It is likely that power lines were present as nearby structures did not have obvious above ground power connections, but certainly had access to electricity. After moving the aircraft to the grass (Figure 3), the calibration was successful with nominal compass health. However, the RGB sensor was unresponsive to the aircraft electrical bus system. We knew that the issue was somewhere along the sensor mount or connection because we briefly rewired the sensor to the landing gear bus cable, with still no response. While this was a positive note because it was indicative of power issues isolated to the sensor, it still indicated a malfunction.

Figure 2: M600 aircraft being set up for flight.
 
Figure 3: Front view of the aircraft. The aircraft moved to grass to avoid interference.
Unfortunately, we were not able to get the sensor to function properly in the field. We did not have requisite tools to open the aircraft airframe to check on the electrical distribution system. This indicates that we need to construct an appropriate field-kit for this aircraft. However, the fact that we did not open the aircraft's internals worked to our advantage. Later Monday afternoon, without any changes to the aircraft at all, the sensor activated properly. We are not sure what changed in the electrical distribution for the sensor to start. Our best estimates is that weather played a factor. It was very cold the morning we attempted to fly the m600, but not out of the aircraft or sensor's appropriate range. While the temperature range should have allowed for proper sensor function, we believe that condensation may have occurred, disabling the sensor's connectivity to the aircraft.  

Regardless of the actual cause of disconnect, we managed to test fly the aircraft on a Purdue FNR forest test plot in the Martell Forest Thursday afternoon. The aircraft performed as planned in two different flights over a black walnut stand. The goal was to create a 3D mesh, very similar to the original goal with the amphitheater. Data is yet to be processed for the flight, but at first glance it appears to be of quality. Data examples will be shared in the following week's blog post.

C-Astral Maiden Flight

The following morning presented the first opportunity to fly the C-Astral Bramor PPX aircraft. We met early in the morning in our lab space to plan, organize, pack equipment, and head to the amphitheater park. The goal was to map the entirely of the internals to the park at the highest resolution possible without risking flight safety in any capacity. For this reason, our 42MP RGB sensor was chosen. Based on training extent, the following roles were assigned to crew members:

1) Evan (Myself) - Pilot-in-Command
2) Kyle (Sheehan) - Co-Pilot
3) Ian Willey - Equipment Manager
4) Todd Horn - Primary Visual Observer
5) Thomas Gonya - Secondary Equipment Manager
6) Ryan Ferguson - Photographer & Observer Control
7) Dylan McQueen - Ground Control Lead
8) Krysta Rolle - Ground Control Support and Assistant Visual Observer

Normally we would likely not have everyone present, but being the maiden flight, everyone played a role. During the checklist, everyone stepped in to provide guidance where needed as the four required crew members performed their roles (Figure 4). This helped ensure nothing was missed.
Figure 4: The majority of the crew assisting in checklist steps.

Being the pilot, my primary task was to complete all steps regarding the digital elements of the checklist. This includes manipulating the flight control devices such as the control tablet and communication transmitter. This also includes setting model, checking critical waypoint settings, and checking aircraft sensor conditions (Figure 5).
Figure 5: Myself, manipulating the flight controls before the motor test step of the checklist.

 By the time of aircraft launch, we had at least triple checked each flight setting. These included the extremely important takeoff, home, rally, parachute, and landing points. Each of these points are responsible for how the aircraft steps-up and steps-down from altitude before and after the survey mission. These steps are extremely critical to a safe and successful mission, and the PIC's primary task is to get the aircraft between these points as best as possible. To do this, close control of altitude, speed, turn radius, and general awareness of environmental factors is needed.

The aircraft launch went smoothly after a slightly concerning dip after takeoff. The likely reason is because we chose launch direction mostly based on obstacles, not strictly wind direction (Figures 6 & 7).

Figure 6: Aircraft immediately after takeoff. 

Figure 7: Aircraft in initial climb.
 
Once in flight, the aircraft circled the takeoff point in a climb to 75 meters. This height was low enough to deploy the parachute if needed, and high enough to safely avoid all obstacles with room to spare. While the aircraft was in this stage of flight, the observer crews dispersed to a variety of locations throughout the park. These areas provided great visual line of sight with the aircraft, as well as the surrounding environment, from all areas. My Co-Pilot, Kyle, acted as my voice in our group's radio communication network.

After time was provided for crews to spread out and for the flight crew to observe the flight condition and status of the aircraft, the mission was commenced. The aircraft was tasked with climbing to 120 meters for the survey at a cruise speed of 16 m/s. Strangely, the aircraft actually overshot the cruising altitude to what was set in altitude override, despite that setting being not engaged. This was immediately corrected by engaging the altitude override setting, and setting the aircraft to cruise at the requisite 120 meters. In flight, the aircraft flew the survey flawlessly (Figure 8). We also realized that the aircraft was visible at the set altitude from the launch site almost the entire time. A single remote observer crew, or perhaps two if available, would be more than sufficient.
Figure 8: Aircraft in survey mission, passing over photographer, Ryan Ferguson.
 At the end of the survey, about 25 minutes later, the aircraft returned to the rally point. The rally point was to the South of the landing and launch points. Once we decided it was time to the land, the aircraft entered landing mode. From there, the aircraft  began a spiraling decent to 55 meters. Strangely, the aircraft appeared to be much lower than the set height, and it looked like it was narrowly missing trees that were no more than 20 meters tall at most. This was almost certainly because of perception, as we are all used to much smaller fixed wing aircraft, and the aircraft was likely quite high over the trees.

Parachute deployment was perfect, but the aircraft landed quite far away from the supposed landing site. Our assumption is that the slight tailwind was greater than expected slightly at altitude, and thus caused the aircraft to have to slow down further for successful deployment and have a longer parachute glide distance.

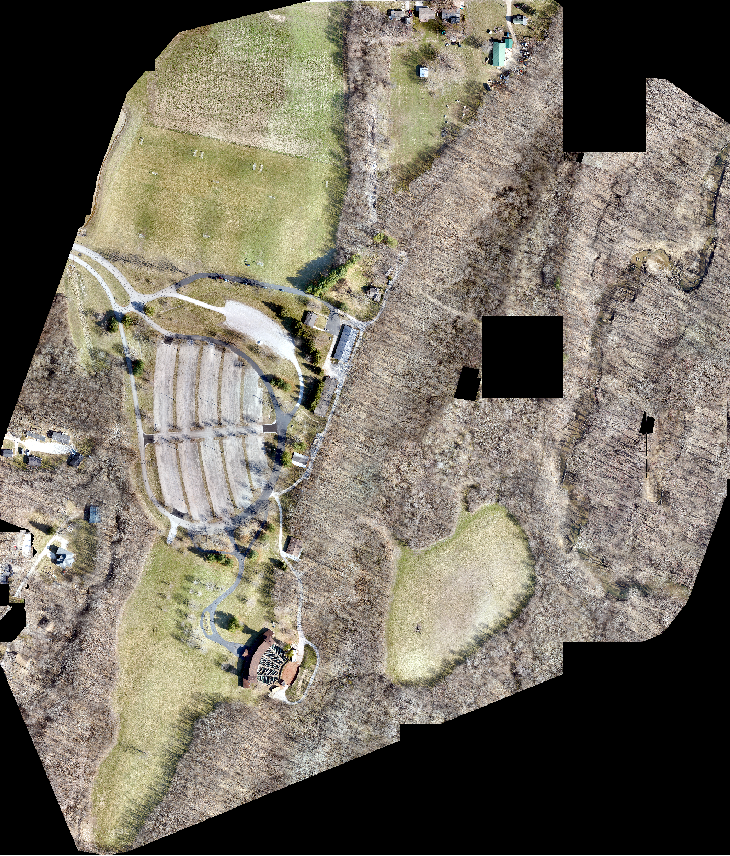
Overall the flight lasted about 34 minutes with 460 images taken (figure 9). The aircraft traveled almost 35 km, and we later confirmed that the surveyed areas was about 75 hectares. Immediately returning to lab, the aircraft's data was inserted into the pre-processing pipeline with PPK correction. Some confusion has arisen with the PPK corrected data, as the initial orthomosaics appear to have spatial mismatch issues with basemap images beyond what is acceptable. Further explanation will be covered in next week's post which will be very data centered. Examples of the data products from this flight, as well as flights next week, including an explanation of our pre-processing pipeline, will be covered.

Figure 9: Flight summary produced post flight.


Changes for Next C-Astral Flight

Some major considerations will be made by next week. The first, we will no longer prioritize obstacle issues over wind direction for launch. The aircraft has a relatively low stall speed, so it is understandable how a slight tailwind would be conducive to a dramatically increased takeoff distance before climb out. This needs to be factored in further in the future. We will try to better understand the purpose of altitude override and why, even when disabled, it influenced flight altitude. We will also add a checklist item to ensure that this step is set to desired cruise altitude. This should remove any issues the function may cause. After the survey is complete, the landing point, and likely the rally point, will be reevaluated based on winds better. While the aircraft is capable of landing with the wind, and may be necessary some times,  a headwind should provide for more controlled performance. When flying at the same field, we will rally out in front towards where the takeoff point was, so that headwind landings are more likely throughout the spring. Despite these lessons, this flight was a successful maiden and data collection flight with our flagship platform. Many more data collection missions will be happening throughout the following month with this platform. See figure 10 to see an examples of notes taken in the field that correlate to this section of the blog post.

Figure 10: Field notes for flight and this final section.