Monday, January 28, 2019

Third Post

Week of 1/21/2019


File Pathing

This week, the focus shifted back towards file/folder pathing and demoing potential processing workflows. The folder path structure assigned is fairly simple, and just adds the appropriate folders to the research drive. The new folder structure takes a "broad to specific" approach. The first folder is a data folder for the course, than a specific folder for this semester, then a set of folders for any type of information needed to be saves such as data or flight area shape file assignment. Within the data folder, specificity increases with a folder for location codes (see week 2 post for explanation of location codes), with each location having its own folder. Within a location folder, a folder for GCPs exist as well as a data type folder. Within the data type folder, folders exist for each type of data we plan to collect such as geospatial video or multispectral imagery. Inside each of those folders, missions are saved as per the naming structure assigned in a previous blog post. Within the mission folders, a folder for images, processing, analysis, and final products exists.

While there is obviously many folders to click through in this structure, it should make it easier to find specific data sets. This is because one simply clicks on the information of the data they are searching for until they reach the final dataset.


Demo Dataset

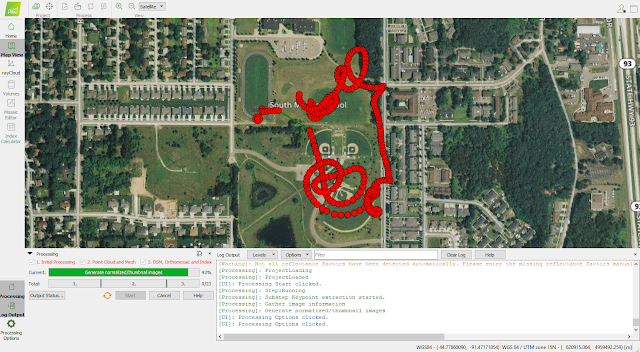
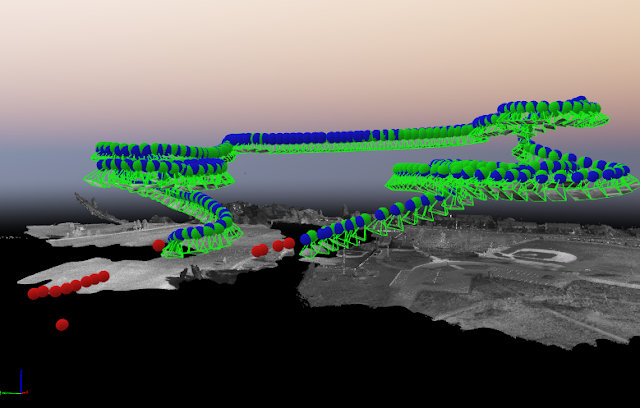
The second task of the week was to test Pix4D on the new lab computers. Photogrammetric workflows had yet to be tested on the new computers, so I ran a simple multispectral orthomosaic processing workflow in the program. The data set I used was collected during a launch and land test flight of the C-Astral Bramor fixed wing aircraft, so the data was not collected in a mapping mission. I chose this data set because it would mean some of the data collected would be of lower value, unlikely to properly rectify or rectify accurately. The test flight provided a heterogeneous set of data to interact with during processing and while inspecting products. The entire data processing workflow took approximately an hour and a half to complete on the weaker set of computers in the lab (32gb of RAM).  While there were areas of lesser quality in the final orthomosaic, DSM, and textured mesh, this was expected with the erratic flight path of the aircraft. There is no indication that Pix4D would not suffice as the processing software for this project on these computers.

Figure 1: Pix4D main processing screen


Figure 2: Orthomosaic with cameras transposed onto the imagery in 3D. Shows flight path of the aircraft

Figure 3: zoomed in image of the orthomosaic in the NIR band. Relatively strong mosaic data quality (straight roads) with only a few errors (dark area west of baseball diamond)

Monday, January 21, 2019

Second Week Report: Deliniating Flight Areas

Week of January 7

During this cold January week, our team focused on additional preparation for upcoming flights when the weather improves. Where as last week was generally a complete team effort to plan folder pathing, this week we all worked in smaller groups. Some people worked on preparing equipment such as practicing packing the C-Astral parachute and setting up our ground control GPS system, others worked on scheduling, document organization, and general flight planning. I headed up the two man team of myself and operations manager Kyle Sheehan to plan our operational zones and define the boundary of our test site. This job is critical to complete early as no flights can be completed without clearly defined areas of interest.

The Plan

In planning our flight areas, several things were determined to be particularly pertinent. First, we would develop an overall operation area that is very large and potentially a reach to expect that we will cover it all consistently at a very high temporal resolution. This is because it will be easier to shrink our operational area if need be and prioritize dynamic areas throughout the season versus areas that end up not being particularly interesting. It is easier to understand phenomena within an area we are examining and adjust our parameters based on phenomena than to discover phenomena outside of our operational area. We also wanted to make sure that the land cover types contained in our test area were heterogeneous so that we could see how events such as flooding may impact different landscape types. We also planned to breakdown our overall flight area into sections. These sections would be the areas that are actually flown on certain missions and are assigned to flight crews. These sections would be based on a few different factors such as landscape types, size, interesting features, and expected phenomena. There is overlap between sites to some degree, so that way higher resolution flights of a smaller area can be chosen versus a larger area courser spatial resolution operation if desired. We based flight area size on expected aircraft as well. This way our fixed wing platform can operate at its capability, providing us better spatial extent, versus flight areas designed for the multirotor that do not cover as much area. Some flight areas would not take into account factors such as proximity to the river (chance of flooding) or topography, but may take into account for covering as much forest as possible. Other flight areas may cover various landscape types (forest, grassland, urban, water, etc) but are focused in areas where phenomena such as flooding are expected, or follow a topographical gradient. By having a diversity in sections, we can adjust flight planning throughout the semester based on need while also ensuring consistency of data. We also needed the sections to have geospatially consistent boundaries. This is so repeatability can be guaranteed and to minimize ambiguity of how flight areas are defined. For that reason, Arcmap was chosen to produce polygon vector data to define the sections (Figure 1). This type of vector data can be exported directly into flight planning software so that the exact same area will be covered each flight across all platforms and sensors.

Figure 1: Using Arcmap to define flight areas


The Result

Our test area is defined in figure 2. The extent of the test area covers the entirety of the amphitheater park, as well as a portion of Davis Ferry park across the river. Some of the sides of the polygon that may seem random or exclusive to portions of forest are structured to avoid private property or roadways. Overall, the site covers several land classes that may be of interest and dynamic throughout the Winter and Spring.

Figure 2: Chosen test area contained within red polygon


Within this polygon, 14 individual flight areas were created (Figure 3). As is apparent, some of these areas are significantly smaller than others. That is because some missions are designed to create different data products, such as the smallest section that is designed to create 3D models of the amphitheater. All the sections, as well as the test site, utilize the WGS 84 Zone 16 projected coordinate system.  The sections were given 5 letter codes for identification. While these codes may complicate things at first because they may not  be as simple to remember, they may minimize confusion between similar sites if a longer description was used. The identification code descriptions are shown in Figure 4.


Figure 3: Flight sections

Figure 4: Descriptions for each flight section


Next Steps

Several more developments need to be completed before flights can be completed. Predominately, this is the creation and finalization of all the folder structure for both the research and class drive. Some preliminary fieldwork must also be completed to gather permanent ground control points, important features, and potential concerns for each flight section.

Monday, January 14, 2019

AT 419, the first week

Week of 1/7/2019

Here on forward, this blog will act as a weekly progress log for the second capstone course, AT419.
This capstone will be a group effort as described in previous posts in this blog, in particular the posts in or near December. Being in the heart of winter with limited flying days and an exceptional need to design the workflows and communication infrastructure around the project, The first few weeks of this blog going forward will certainly be structured around organization of the project. Being that I am the primary member in charge of data, my initial tasks have been to build up the data infrastructure and processes so that once we have collected imagery, it can be organized and handled with the greatest efficiency. We have so many distinct roles in this project that I must be sure to communicate the structure of the data management effectively and provide the opportunity for ground members to give me feedback about what they would like to have access to and if my proposed processes are intelligible.

Wednesday Meeting and the Public Access Pipeline

Before our second meeting of the class, I had sketched notes regarding ideas for data management in my field notebook (Post Index, Figure 1). Using these notes, I led a discussion with the class to identify how to best store data within our two server drives, research and classes. We determined that it is likely best for everyone to have read access to everything. This is ideal so that people can see the state of processing, have download access to any information or data they might like at any state from collection to final deliverable, and check the data-team's work. However, we all agreed that not everyone needs write access to the research drive. The reason for this is not so much out of a lack of trust, but instead out of data integrity concerns. Accidents happen, and if someone deletes, moves, alters, or otherwise disturbs data or folder structure in the path where processing and analysis is occurring, it may be very difficult to correct the issue.

The address this problem, a common data dump will be available in the classes drive, within an AT419 folder.  Within the AT 419 folder is a folder for missions, where we are defining a mission as a single data gathering operation regardless of how many flights were needed to gather the requisite data, as long as the same aircraft and sensor was used (I.E. regardless of battery swaps). Within the mission folder, each mission is saved with the following naming structure:

mmddyy_ac_sensor_altitude

mmddyy = month/day/year
ac = aircraft
Sensor = sensor carried on aircraft
altitude = height the aircraft was flying agl

within the mission specific folders is a folder for each given flight, simply titled:

Fx_time

where x is the number, in order of conducted flights, needed to complete the mission. So the second flight after a battery change would have the designation, F2. The time is the 2400 clock time for which the flight began. We may be doing high temporal analysis so time values are being used.

Within each flight folder, meta data, imagery, and aircraft files specific to any given flight will be saved.

A visualization of this process can be seen in Post Index, Figure 1. Two diagrams created during this meeting showing two different options we were considering for folder structure can be seen in embedded figures 1 and 2.

After data is left by any team member in the data dump, myself or any future data team members will move the data over to the research drive where the data processing and analysis, as well as long term data storage, will be conducted. All other members will have access to the research drive to read or download, but not write, data. The research drive has not been fully mapped and the final research drive design will be finished in a later week.

Figure 1: A folder structure design with limited class access. Image also includes early metadata concept.


Figure 2: A later design showing the beginnings of the closed research drive architecture (left side dashed box) and how the data dump will act as the intermediate step where field crews drop data. The mission naming structure and internal file structure also drawn.

Metadata Setup

The other major task to be completed this week was the creation of a metadata format. The inspiration, but not final, version of the metadata format is seen in figure 1, or figure 1 of the post index. I created the final metadata values needed for each operation after it was discussed in meeting. In addition, I developed a guide describing how each metadata category should be filled out. To keep everything consistent, especially if some of the future analysis is run through script, some of the metadata categories have a code, such as the sensors. These codes will also be used in the file naming structure. After creating the metadata form and guide, I also created an example metadata sheet so that people can see how to best fill out the form. The metadata form, guide, and example are available for download here:

Meta Data Form, Guide, and Example Download


Next Steps

The next step on this topic is to finalize a research drive folder structure and create a guide to saving data with Ryan and Ian of the systems integration team. Being that they will have the say as to how the equipment is put away after a mission, a combined guide as to then store the data would be useful. However, neither of these are of the highest priority in the short term. In the next update, a completed or mostly started rendition of operation zones within our research area should be the primary topic. I will be using arcmap generated shapefiles to accomplish the zoning of flight areas in accordance with Kyle, the operations manager.


Post Index


(P.I.Figure 1): Notebook page for this week showing folder structure and metadata format