Monday, February 25, 2019

Week of 2/18/19: Poster and Mothod Development

This week, Krysta and I focused on developing the poster further. In particular, two major tasks have been underway. The first task is a comprehensive literature review structured around finding information specific to our poster topic. Krysta has been leading up a literature review and introduction for the overall project, as we are hoping to publish an academic article at the end of the semester, but we needed more specific sources for the poster. We also worked towards developing a formal methodology that we could test and gather preliminary data for that would double as the main focus of the poster. Being that the literature review would, in theory, be based on our methodology, generating said methodology was the primary task.

Methodology: Flood modeling and boundary delineation accuracy

The topic we have finalized for testing is to compare the accuracy of a flood model generated with a LIDAR digital terrain model (DTM) to a drone imagery method. To be more specific, we will be comparing the model to two different UAS data types: geospatial video and multispectral imagery. The methodology to complete this part of our capstone, and thus the poster, can be split into a few parts.

Ground Data Collection

Ground control points collected through a survey grade RTK gps unit will be used to ensure the accuracy of the drone data in general, but several points will be used for a different purpose, taken at the boundary of the flood extent (see "accuracy assessment" section of post for more information). The Reach GPS unit will be used for ground control data collection.

Model Generation

The model will be generated to estimate the extent of flooding based on rain and river height conditions. ArcPRO will be used to generate this model. A LIDAR DTM will be used to understand the topographic information necessary to generate the model.

Airborne Data Collection

Flights will be conducted with both methods. A geospatial video flight will be flown manually. The aircraft will be flown directly over where the pilot assumes the boundary of the flood to be. The aircraft's GPS system will record position in reference to the video it is generating. This will effectively create a hard boundary with one side of the generated flight path being water and the other being ground.
A second flight will be conducted with a multispectral sensor, likely a micasense sensor. The flight will be autonomous with a predetermined flight area. A conventional pixel based unsupervised classification will be used to identify water pixels from other surfaces. It is difficult to say at the moment if two thematic classes will be made (water versus land) or additional classes will be made (urban, trees, etc) which may be more useful in the long run, past the poster.
Data from both methods will be processed with the requisite software to inevitably generate a shape file of flood extent from both technologies, and in the case of the multispectral technique, an additional raster file.

Accuracy assessment

The accuracy of each method must be calculated with reference data before the accuracy of the model with the aerial data can be compared. It is useless to compare the two data types if neither are calibrated with a more accurate assessment. The GPS points taken at the edge of the river can serve as a reference. By taking the points at the physical boundary of water and land, it also creates a bi-model distribution of pixels. In both techniques, the shapefile ultimately creates a more continuous bi-model distribution of pixels in the same way; that is, one side of the points/lines are water, the other is land. The raster can also be used directly for the multispectral imagery. If a line does not past directly through a GPS point, it is either over or underclassified. Pixels on one side of the line can be considered to be water and the other side, land. One side of the gps point, in the same way, can be considered to be water and the other land, in the same way. Thus, accuracy can be determined by the relationship of classified pixels being compared to the reference points. The following diagrams I generated explain this phenomena:

Figure 1: A fully accurate classification example

Figure 2: An overclassifed example

Figure 3: An underclassified example


Comparison to Model 

After the accuracy of the drone collected data is determined, it can effectively be compared to the model. The model will be classified just as the data collection methods had been. The classification of water will be compared between the model and drone data to determine accuracy, and validity, of the model.

Literature Review

So far, the literature review has been relatively successful. We are looking for journal articles on a variety of topics so that our introduction can be very effective at communicating the point and importance of this work. The list of papers we have collected at the moment can be found here.


Upcoming

This week, we begin the data collection by starting the initial ground survey of ground control points.

Sunday, February 17, 2019

Week of 2/11/2019: Mission Ready Documentation and Poster Presentation

This week saw the completion of an ongoing project, and the start of a new direction in the capstone. Namely, the completion of the final checklist needed for operation and the assignment of mini-projects and associated groups for the School of Aviation and Transportation Technology Poster Symposium (SATT).

The Data Transfer Checklist and Issues with Drone Logbook

The primary and ongoing task of the week was to finish our final checklist before we can begin flight operations once the weather improves. This checklist is the data transfer checklist. Being far more descriptive than a traditional checklist, it is more like a step-by-step extended guide regarding how to properly transfer, save, and format data post-mission. Its purpose is to ensure that there can be a simple transition for data personnel to begin processing the data without confusion regarding where the data is, what the data is, and what should be done to it. In order to remain consistent with other checklists, the Drone Logbook interface was used to store the checklist.

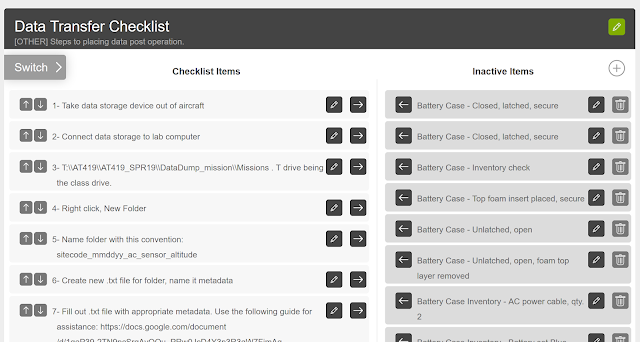
Working with Drone Logbook exposes some of the issues with the technology. First of all, the checklist can only be accessed by either reading it directly from the website, or by starting a flight on a mobile device. This is not necessarily an issue as long as we train flight crews to not conclude the flight until data has been stored. The other issue is the functional style of Drone Logbook's checklist creation interface. Essentially, when someone creates a new checklist, they are just creating an empty bin where steps can be created or moved into. While you can create each step in the active checklist (left of figure 1), it also populates the list of steps that have been created for all checklists (right of figure 1). This not only creates a clunky confusing interface, but it presents functionality issues. If someone accidentally moves over a step from the list on the right, it can significantly alter the order of steps that were in the right location. Because the app does not have a drag-and-drop feature, the arrow buttons must be used to move checklist steps, which is very time consuming and has potential for errors. Another issue with this format is that if I wanted to move a step into the right list (figure 1) that effectively acts as storage, it would be incredibly difficult to find the exact same step because it would be populated somewhere among the massive list of steps containing every step from every checklist we have generated. Drone logbook needs to include a function to bin checklist items in some sort of folder structure that can be filtered out or the feature could become unusable in the long run. Drone operations are simply too complicated with too much variation between ground equipment, vehicles, and residual steps for the Drone Logbook approach to checklists.

Figure 1: Subset of Data Transfer Checklist on Drone Logbook. The left side is a correctly populated list of checklist items. The right is the non-filterable list of inactive items.    


SATT Poster Symposium 

An announcement for our school's poster symposium was made this week, and we decided that we would enter a series of posters. While the complete list of posters seems inconclusive at the moment, what seems certain  is I will be leading the poster regarding the specific type of application our capstone is centered on with Krysta. I will also be conducting preliminary data-analysis as part of the poster, in particular comparing accuracy of different methodologies, which will be useful throughout the rest of the project. Krysta and I will be comparing the accuracy of flood extent delineation between two different drone remote sensing methods. The first will be a manual geospatial video technique, and the second will be an autonomous multispectral photogrammetric approach.  Accuracy will be determined by comparing where flood water can be delineated in each method to ground control measurements taken at the extent of flood waters by ground crews. I suspect that the geospatial video technique will be less accurate, but be able to cover a larger area in far less time than the autonomous technique.

The basic methodology needs to be designed further, as well as various aspects of the poster itself. Most of this will happen next week (week of 2/18). Despite the lack of various details at the moment, I have generated a basic timeline that will be used to gauge progress and ensure all mandatory steps are completed (Figure 2).

Figure 2: Timeline for SATT Poster Creation.

This upcoming week will largely be structured around flushing out the details for the poster. Krysta and I will meet Wednesday to discuss what type of literature review she has completed, what we can take from that, and what additional details we will need. I assume that some additional literature will need to be collected regarding remote sensing of water, the need for flood analysis by air (by drone), and any other specific UAV studies that may have been conducted on this topic.

Saturday, February 9, 2019

Closing in on Functionality: Weeks of January 28th and February 4th

The past couple of weeks have been quite busy with residual non-project related tasks. This is actually why there was no individual post for last week, as I was out of the state interviewing for graduate school positions for multiple days. For that reason, instead of omitting a weekly post all together as I was allotted, I have decided to mix the two week posts into one. This is actually quite beneficial as both my tasks these two weeks are related.

Task 1: Plan a Hypothetical Scenario

The first task, which was been completed in entirety,  was to complete a hypothetical scenario for my classmates to run through while I was absent for interviews. We had been planning a gaming scenario to create, plan, hypothetically execute, and assess a mission so that it would be easy to discover where additional work needs to be conducted as we approach the field season. My job was to come up with an environmental condition that would be beneficial for us to address for our project.This step was important for two reasons. The first reason is so that we can determine if we have the equipment and processing capability to collect data on a short duration event that could occur at any time. The second reason is to see if group members could come up with the correct means of collecting the proper type of information for a given condition. This is a critical skill to train or at least determine how well we can perform because there may be situations during the field season where we would like to collect data of an environmental event that can not be scouted ahead of time and require field teams and flight crews to successfully determine last minute how to fly, where to fly, and with what equipment to fly and collect data. Being that I am the individual with the most data experience, there may be moments where I can not be present to help select which sensor to use and individuals in the field may need to make the executive decision. The hypothetical scenario I tried to build would gauge this ability.

The scenario I planned involved a sudden warm day after significant snowfall (not uncommon in Indiana). This warming event rapidly melts local snow and creates a very significant flooding condition in the Wabash River near our field site. In the scenario, flood conditions were expected to decrease rapidly in a very short amount of time (in a few days) as well as general velocity was expected to decrease. Giving the group this information, a few keep conclusions were expected to be made. First, flooding area should be assessed as well as height and velocity. The hope was that they would also determine that recurring flights over a few days would be useful to determine how accurate the flood forecasting is for the river and to help train/compare flood models we made decide to make later in the semester. For flood area analysis, I would accept any possible type of data collect that could successfully delineate the feature. Geospatial video would be a good option as a UAV could overfly the flood perimeter to help determine how much of our site is flooding. Multi-spectral imagery would also be useful as the spectral difference between water and ground is immense in the near-infrared band. While these two techniques are what I would chose, I would welcome other ideas as this might inform me on other possibilities for the rest of the semester. I did not have any intended aircraft for them to use as this is mostly a topic for other crew members, plus there could hypothetically be any number of options or combinations of aircraft that could help complete this task. Because I did not specify how much area would be covered by the flood, I do not have an expectation for which flight area they should try to cover as long as it is logical and includes the river. I was also hoping they would at least consider flight areas and launching from the opposite side of the river from Tippecanoe park as this area would certainly be flooding in this scenario (lower laying homogeneous landscape). After determining all this, materials prepared by other group members would be included and used in the appropriate point of the scenario to determine if more documentation or information is needed. I was absent when they ran the scenario, so this upcoming week I am sure I will hear of the results.

Task 2: Finish a Data Post-Flight Document

The second task during this time period is still in production as it is time intensive and I had limited availability. By the next weekly report, the expectation is that a data post-flight checklist or guide will be produced. This guide will explain various aspects of data group members will need to interact with that we have already discussed, as well as some new features.

The First step in the document will sound like a continuation of the equipment guides Ryan and Ian's group are producing. It will involve how to manipulate and download data from the SD cards of the aircraft post mission onto the computers. It will detail where to save data so I consistently find it and how to name the information so that I can understand where the data is coming from and its importance. The details of how this will work is in previous posts involving naming convention of files and folders.

The second step will details to creating a metadata file inside of the data folder they are to produce. The specifics of this have also been discussed previously and I have already generated a document that will contain a guide for what needs to be included and how it should be structured for metadata purposes. If this step is done correctly in accordance with previous steps, data should be able to simply be moved from public drives into the correct folder on the research drive and will be ready for processing and analysis.

The final steps of the guide will again sound like a checklist. These steps will first discuss how to properly reformat the SD cards so that data is properly wiped. The rest of the list will involve placing the SD cards back into the aircraft or sensor. Lastly, how to store the aircraft depending on its specific schedule (should it be flying very soon or after a few days). This guide will be the final of the checklists and should complete our capability to begin data collection missions. With any luck and a change in the weather, we should begin flying data collection missions soon.